It’s time to extend the model to include storage. Early in this series, I described the three metrics for how big an energy storage system is: energy, power when charging, and power when discharging. For EPS, as for many other storage technologies, these are somewhat independent. To increase the energy parameter, we can add more water storage. To increase the charging (storing) power, we can add more pumps. And to increase the discharging (generating) power, we can add more turbines. The separation isn’t perfect, because some components (like penstocks) are affected by all three, but it’s good enough.
So I’ve made the cost per kWh of energy, the cost per kW of charging power, and the cost per kW of generating power all separately adjustable parameters in the model. Also adjustable, of course, are the amounts of each to be included in a particular scenario. So far I’ve assumed energy costs in the range of $25 to $100 per kilowatt-hour1, and power costs in the range of $100 to $500 per kilowatt. The cost of a hypothetical EPS system is the sum of the three costs, times the amount of each respective “quality” included. (A different storage technology, such as batteries, could be modeled the same way, by plugging in different numbers.)
The following parameters are all fixed for the round of simulations I’ll be discussing:
| Parameter | Value |
| Storage cost, $/kWh | 40 |
| Cost per kW of generating power | 10 |
| Cost per kW of storing power | 10 |
| Solar peak watts per square meter | 220 |
| Solar panel efficiency, percent | 20 |
| Solar cost per peak watt, $ | 1.30 |
| Wind cost per peak watt, $ | 1.44 |
| Natural gas purchase cost per kWh, $ | 0.065 |
| Natural gas “carbon tax” per kWh, $ | 0.04 |
After a number of small studies to make sure the model was working correctly, I ran a large matrix study to explore many combinations of wind, solar, and storage parameters; this table shows which parameters are varied, and over what ranges (the number of values tested for each parameter are uniformly spaced from the start to the end of the range):
| Parameter | Range | # of Values Tested |
| Storage capacity, gigawatt-hours | 1 to 50 | 8 |
| Peak storage power, gigawatts | 0.4 to 4 | 3 |
| Peak generating power, gigawatts | 0.4 to 4 | 3 |
| Solar capacity, peak gigawatts | 0.1 to 5 | 8 |
| Wind capacity, peak gigawatts | 1 to 10 | 8 |
Since every combination is simulated, this study comprised 8 x 3 x 3 x 8 x 8 = 4,608 individual scenarios.
Reasonably Priced Storage
We know that solar and wind gets us pretty far, and that storage tends to be costly, so first I’ll find the scenario with the best storage bang for the buck. In other words, in what system did the addition of storage leave the greatest amount of additional gas unburned, compared to wind and solar alone, per dollar spent on the storage facility? The answer is this one, scenario #2040:
| Parameter | Value |
| Storage capacity, GWh | 22 |
| Peak storage power, GW | 2.2 |
| Peak generating power, GW | 2.2 |
| Storage system cost (energy aspect), $billions | 0.88 |
| Storage system cost (power aspect), $billions | 0.44 |
| Storage system cost, total, $billions | 1.32 |
So this has 2.2 times the energy storage of the Capitan model (too big to fit on the Capitan site, but there are larger sites not very far away). It also has much higher peak power, both for charging and discharging. (In the customary journalistic language I complain about, this would be “2.2 gigawatts of storage.”) Here’s how it performed when teamed with 5 peak gigawatts of solar and 1 peak gigawatt of wind:
| Parameter | Value |
| Gas unburned attributable to solar + wind, GWh | 7,620 |
| Gas unburned attributable to storage, GWh | 4,590 |
| Total gas unburned per year, GWh | 12,210 |
| Carbon emissions reduction due to solar + wind | 55% |
| Carbon emissions reduction due to storage | 34% |
| Net carbon reduction, whole system | 89% |
| Gas unburned per capital dollar, solar + wind, kWh/$ | 0.96 |
| Gas unburned per capital dollar, storage, kWh/$ | 3.48 |
Since this system was the most cost-effective for reducing emissions, we’d expect it to be finely tuned to daily conditions, and to charge and discharge most of its capacity on most days. Here is what the simulation shows:
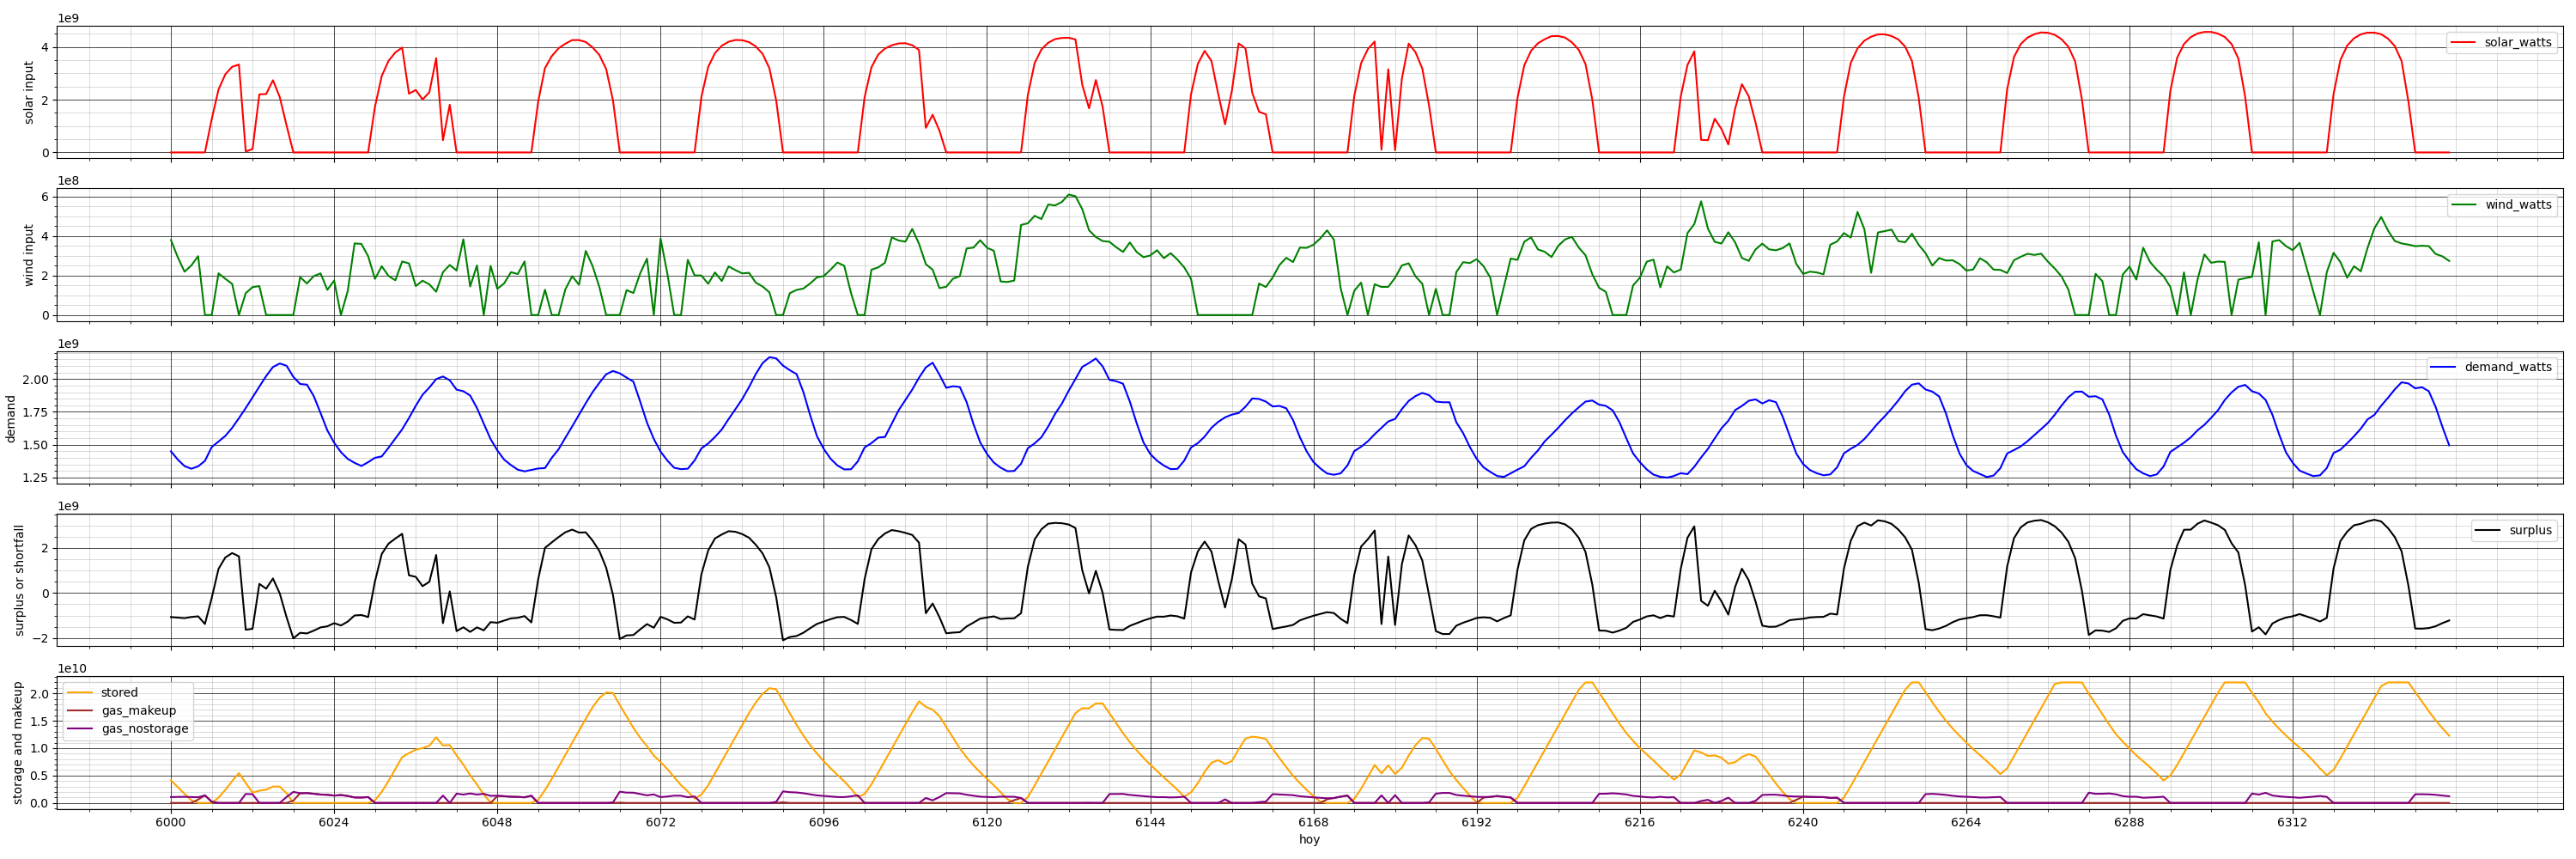
This chart shows two weeks starting at hour 6000 (day 250) of the year, which in 2013 was September 8th. As usual, abundant solar energy is taking care of the daylight hours, even on the partly cloudy days. The orange line for storage is nearly ideal for a storage system intended to cover the daily shortfall between sundown and sunup: it’s a sawtooth, charging all day, then returning power to the grid throughout the shortfall, ending up mostly discharged just around the time the solar power kicks in again in the morning. If it had faster charge or discharge rates, that would be wasted money, since it’s already keeping up. If it had more energy storage, some of that storage would sit idle on many days, lowering the emissions reduction per dollar spent.
This particular system keeps 89% of the gas in the ground, compared to the natural-gas-only baseline for meeting PNM’s 2019 electrical demand. In absolute terms, that’s 12.2 terawatt-hours. From the price assumptions above, combining the cost of buying the gas with a moderate carbon tax, it costs 10.5 cents to make 1 kWh by burning gas, so 12.2 terawatt-hours of gas savings is worth $1.28 billion per year. The full wind + solar + storage system costs $9.3 billion to build, so the payback time will be about 7 years and 3 months.
If, as in the U.S. at present, there is no penalty whatsoever for CO2 emissions, then we only save the actual cost of the gas, 6.5 cents per kWh. In that scenario, the system payback time becomes about 13 years.
Now let’s look at the payoff of the storage system itself, assuming it will work with solar and wind generating capacity that has already been built independently. (The wind, solar, and storage are all on the grid, so they can interchange power; we just need them to be close enough together for transmission losses to be reasonable, a distance measured in hundreds of miles.) The storage system keeps 4.59 terawatt-hours’ worth of gas in the ground per year, with a value (gas purchase plus carbon tax) of $482 million. The storage system cost $1.32 billion to build, so its payoff time is appealingly short: 2 years and 9 months. Even without the carbon tax component, the system is paid off in 4 years and 5 months.
Carbon Reduction A La Carte
89% carbon reduction is pretty good, but lately, a lot more people are talking about 100% as the only acceptable target. We can use the 4,608 scenarios in our study to look more generally at the question of how much it will cost to get PNM to various levels of carbon reduction.
I divided the scale of carbon reduction into buckets of 5%—i.e. at least 80% reduction but less than 85%, at least 85% but less than 90%, and so on. So, we have 20 buckets to cover the full range starting at 0% reduction, plus an extra bucket for the special case of 100% reduction. Then, for each bucket, I found the least expensive wind + solar + storage scenario that resulted in a carbon reduction number that’s within that range. For comparison, I also found the least expensive wind + solar only (no storage) system in each bucket. Here is the result:
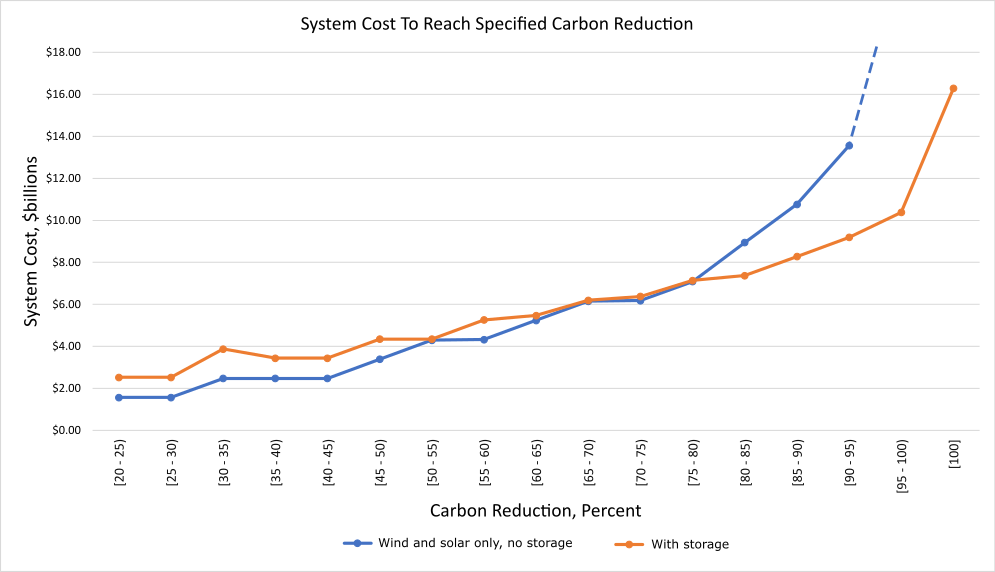
There are several things to note in this plot. First, the range of carbon reduction below 20% isn’t there at all. That’s because none of the scenarios in this study had small enough wind and/or solar capacities to produce carbon reductions that low. Next, for carbon reductions below about 60%, storage isn’t worth the cost—there are still many hours of high demand, along with high solar or wind potential, that we can cover by adding more solar panels or wind turbines (in other words, we haven’t run out of low-hanging fruit). The orange line tends to be above the blue line here, because even the cheapest storage system included in the study costs something; but that storage system typically contributes less than 1% to the overall carbon reduction in this range.
Finally, storage really starts to pay off in the range of 80% carbon reduction or more, as the cost of wind and solar only (blue line) starts to take off exponentially. That’s why the blue line is missing two points at the right end of the chart: the least expensive wind + solar solution in the 95-100% range is far off the scale at $128 billion (dotted line), and it proved impossible to get all the way to 100% with wind and solar, even by spending trillions of dollars. By contrast, a 95% carbon-free grid can be had for $10 billion if we include storage; and for about $16 billion, we can reach 100%.
The best system with 100% carbon reduction has 50 GWh of energy storage (versus 22 for the system I examined earlier, and 10 for the original Capitan design), and here is how it behaves starting on September 8th:
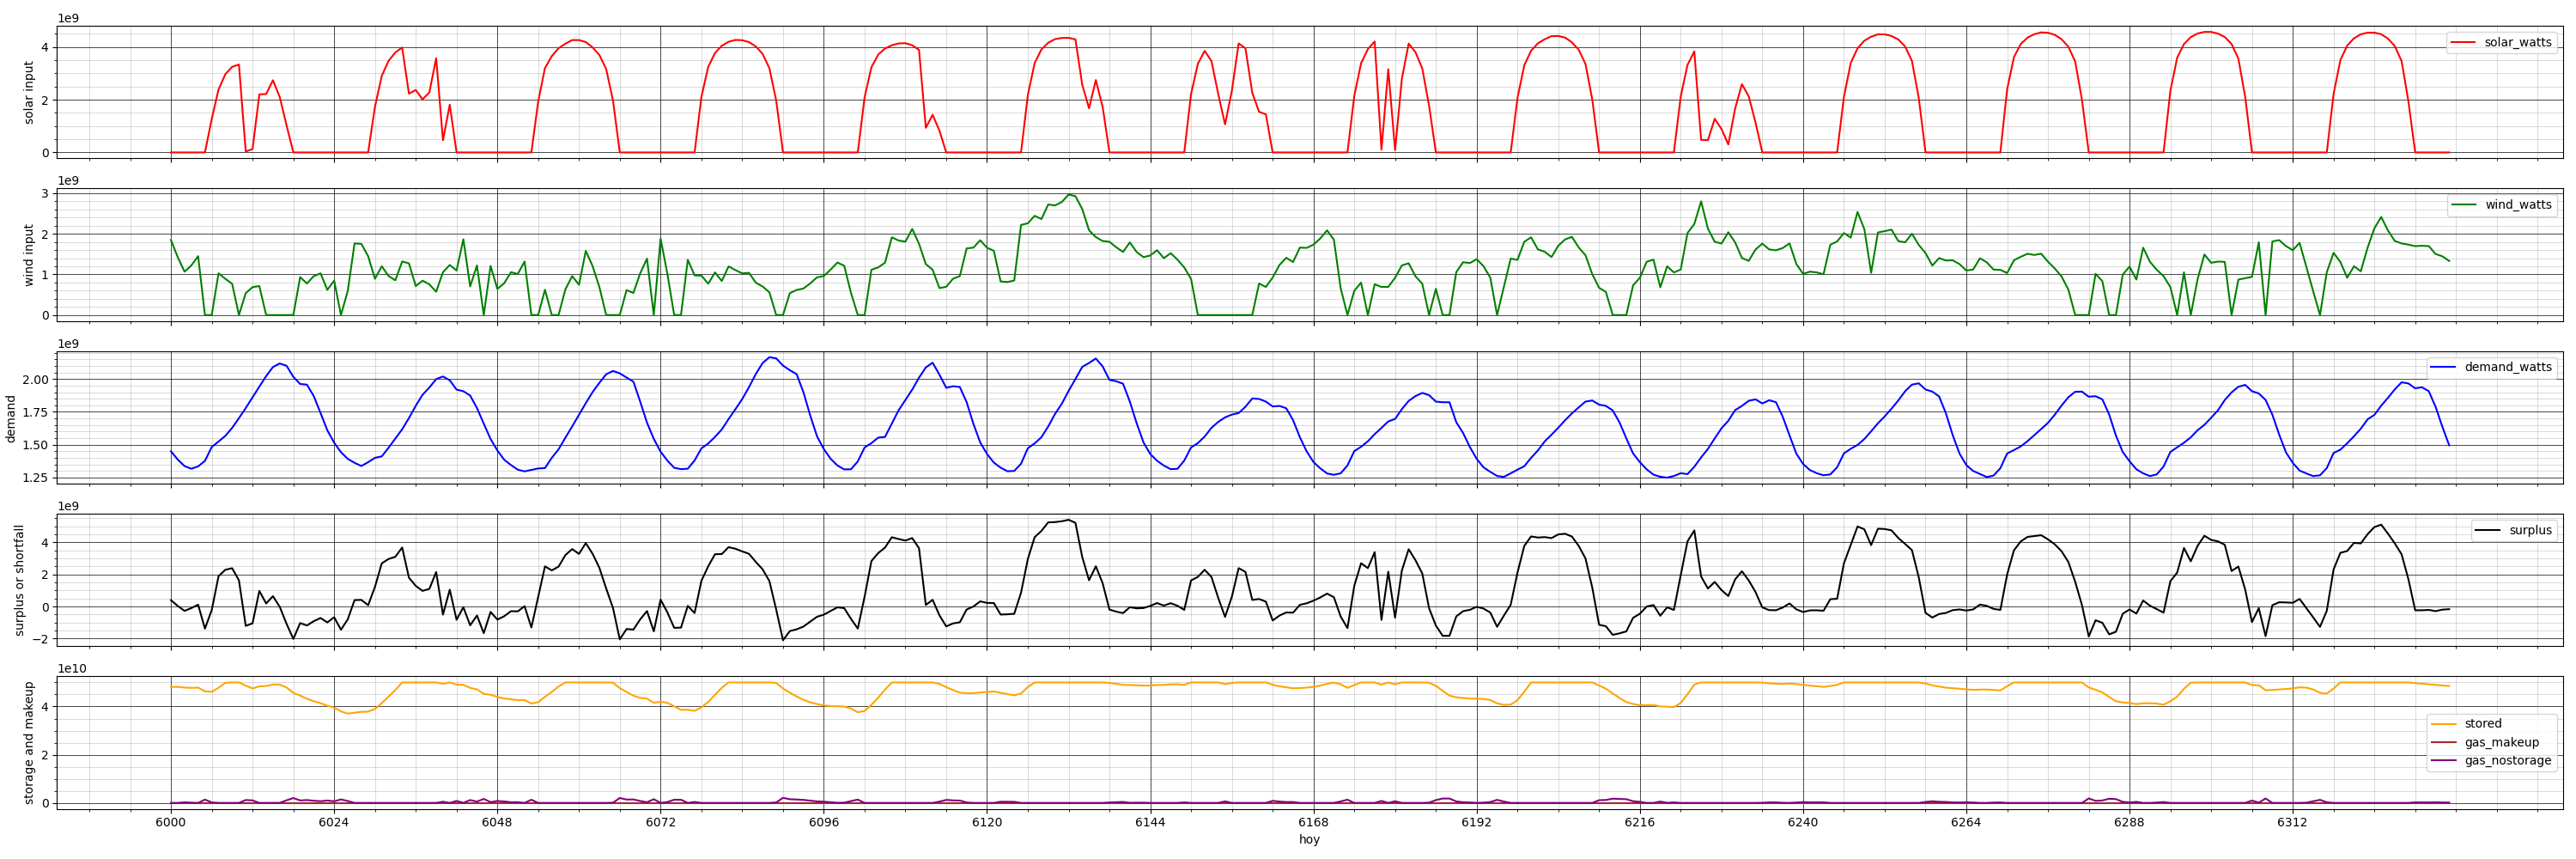
This is just what you’d expect. The energy storage capacity is so large that it stays nearly full in all typical weather conditions (orange line). It would take a very unusual period of heavily overcast and windless weather to drain it completely. Of course, weather forecasters would have a good idea of how long such a period might last, and by asking some heavy industrial and commercial users to shut down temporarily, electrical service for essentials could be kept going for some days on storage alone with a system this large.
The plot of cost versus level of carbon reduction above is not as smooth as I would expect it to be. I think the reason for the jaggedness is that 4,608 scenarios are really not enough to cover such a wide range of parameter choices and find the very best solution for each decarbonization bucket. Still, the overall trends are clear.
This model treats the PNM service area as an isolated region, unable to exchange electricity with its neighbors, when in reality (particularly if the neighbors are also substantially decarbonized), that kind of exchange will be beneficial. The whole question of transmission lines—what they cost, how much power they waste, and whether and where they can be built at all—is interesting and important, but out of scope here.
A final note: I’ll be glad to supply my code, sources for price estimates, etc. to anyone who asks.
Previous: Encapsulated Pumped Storage, Part 14: Modeling The Benefits
Next: Encapsulated Pumped Storage, Part 16: Lessons From Modeling